
")


Key Highlights
- Single-family existing-home sales prices rose in 89% of measured metro areas – 201 of 226 – in the fourth quarter, up from 87% in the previous quarter. The national median single-family existing-home price climbed 4.8% from a year ago to $410,100.
- Thirty-two markets (14%) recorded double-digit annual price appreciation (up from 7% in the prior quarter).
- The monthly mortgage payment on a typical, existing single-family home with a 20% down payment was $2,124 – down 1.7% from one year ago.
WASHINGTON (February 6, 2025) – Almost 90% of metro markets (201 out of 226, or 89%) experienced home price increases in the fourth quarter of 2024, as the 30-year fixed mortgage rate ranged from 6.12% to 6.85%, according to the National Association of REALTORS®' latest quarterly report. Fourteen percent of the 226 tracked metro areas posted double-digit price gains over the same period, up from 7% in the third quarter.
"Record-high home prices and the accompanying housing wealth gains are definitely good news for property owners," said NAR Chief Economist Lawrence Yun. "However, renters who are looking to transition into homeownership face significant hurdles."
Compared to one year ago, the national median single-family existing-home price elevated 4.8% to $410,100. In the previous quarter, the year-over-year national median price increased 3.2%. In the past five years, from 2019 to 2024, the median home price rose by 49.9%.
Among the major U.S. regions, the South registered the largest share of single-family existing-home sales (45.1%) in the fourth quarter, with year-over-year price appreciation of 2.1%. Prices also increased 10.6% in the Northeast, 8.0% in the Midwest and 4.0% in the West.
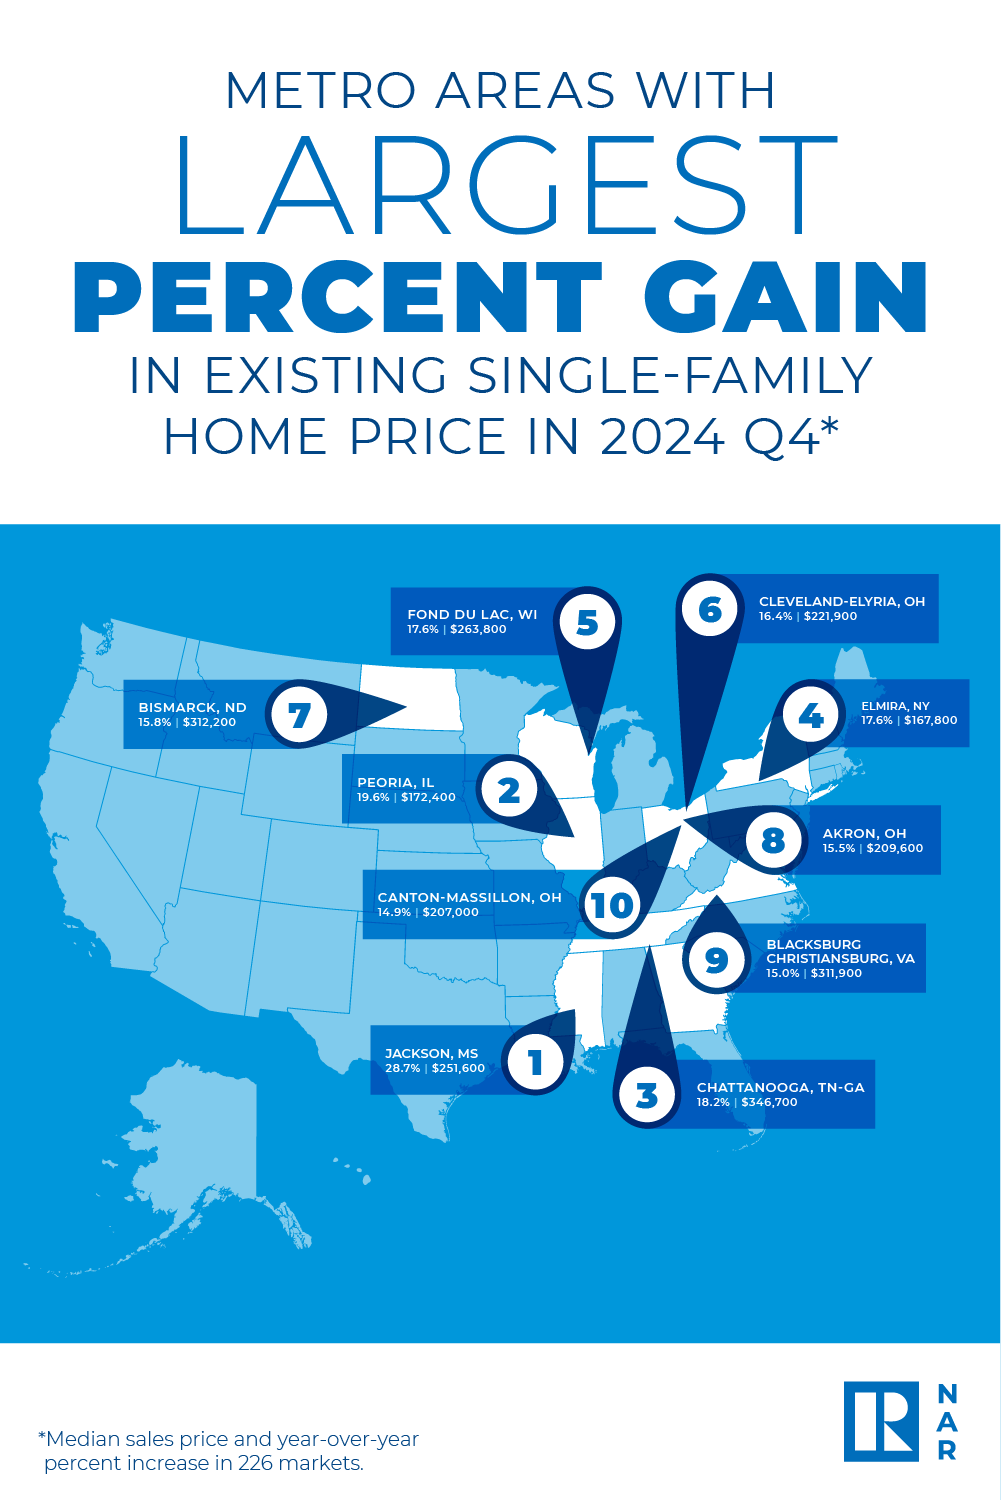
The top 10 metro areas with the largest year-over-year median price increases, which can be influenced by the types of homes sold during the quarter, all experienced gains of at least 14.9%. Six of the markets were in the Midwest. Overall, those markets were Jackson, Miss. (28.7%); Peoria, Ill. (19.6%); Chattanooga, Tenn.-Ga. (18.2%); Elmira, N.Y. (17.6%); Fond du Lac, Wis. (17.6%); Cleveland-Elyria, Ohio (16.4%); Bismarck, N.D. (15.8%); Akron, Ohio (15.5%); Blacksburg-Christiansburg, Va. (15.0%); and Canton-Massillon, Ohio (14.9%).
Eight of the top 10 most expensive markets in the U.S. were in California. Overall, those markets were San Jose-Sunnyvale-Santa Clara, Calif. ($1,920,000; 9.7%); Anaheim-Santa Ana-Irvine, Calif. ($1,360,000; 4.7%); San Francisco-Oakland-Hayward, Calif. ($1,315,600; 5.2%); Urban Honolulu, Hawaii ($1,103,100; 3.2%); San Diego-Carlsbad, Calif. ($985,000; 5.7%); Salinas, Calif. ($943,900; -5.0%); Los Angeles-Long Beach-Glendale, Calif. ($939,700; 6.3%); San Luis Obispo-Paso Robles, Calif. ($927,200; 1.7%); Oxnard-Thousand Oaks-Ventura, Calif. ($920,000; 0.3%); and Boulder, Colo. ($840,700; -1.0%).
Almost 11% of markets (24 of 226) experienced home price declines in the fourth quarter, down from 13% in the third quarter.
"While recognizing many workers may not have the option to relocate, those who can or are willing to move may find more affordable conditions, especially given the wide variance in home prices nationwide," Yun said.
Housing affordability marginally improved in the fourth quarter. The monthly mortgage payment on a typical existing single-family home with a 20% down payment was $2,124, down 0.8% from the third quarter ($2,141) and 1.7% – or $37 – from one year ago. Families typically spent 24.8% of their income on mortgage payments, down from 25.2% in the previous quarter and 26.5% one year ago.
First-time buyers found slightly better affordability circumstances compared to the prior quarter. For a typical starter home valued at $348,600 with a 10% down payment loan, the monthly mortgage payment declined to $2,083, down 0.9% from the previous quarter ($2,101). That was a decrease of $35, or 1.7%, from one year ago ($2,118). First-time buyers typically spent 37.4% of their family income on mortgage payments, down from 38.1% in the prior quarter.
A family needed a qualifying income of at least $100,000 to afford a 10% down payment mortgage in 43.8% of markets, up from 42.5% in the previous quarter. Yet, a family needed a qualifying income of less than $50,000 to afford a home in 2.2% of markets, identical to the prior quarter.
About the National Association of REALTORS®
As America's largest trade association, the National Association of REALTORS® is involved in all aspects of residential and commercial real estate. The term REALTOR® is a registered collective membership mark that identifies a real estate professional who is a member of the National Association of REALTORS® and subscribes to its strict Code of Ethics. For free consumer guides about navigating the homebuying and selling transaction processes – from written buyer agreements to negotiating compensation – visit facts.realtor.
# # #
Data tables for MSA home prices (single-family and condo) are posted at https://www.nar.realtor/research-and-statistics/housing-statistics/metropolitan-median-area-prices-and-affordability. If insufficient data is reported for an MSA in a particular quarter, it is listed as N/A. For areas not covered in the tables, please contact the local association of REALTORS®.
NOTE: NAR releases quarterly median single-family price data for approximately 220 Metropolitan Statistical Areas (MSAs). In some cases, the MSA prices may not coincide with data released by state and local REALTOR® associations. Any discrepancy may be due to differences in geographic coverage, product mix, and timing. In the event of discrepancies, REALTORS® are advised that for business purposes, local data from their association may be more relevant.
1 Areas are generally metropolitan statistical areas as defined by the U.S. Office of Management and Budget. NAR adheres to the OMB definitions, although in some areas an exact match is not possible from the available data. A list of counties included in MSA definitions is available at: https://www.census.gov/geographies/reference-files/time-series/demo/metro-micro/delineation-files.html.
Regional median home prices are from a separate sampling that includes rural areas and portions of some smaller metros that are not included in this report; the regional percentage changes do not necessarily parallel changes in the larger metro areas. The only valid comparisons for median prices are with the same period a year earlier due to seasonality in buying patterns. Quarter-to-quarter comparisons do not compensate for seasonal changes, especially for the timing of family buying patterns.
Median price measurement reflects the types of homes that are selling during the quarter and can be skewed at times by changes in the sales mix. For example, changes in the level of distressed sales, which are heavily discounted, can vary notably in given markets and may affect percentage comparisons. Annual price measures generally smooth out any quarterly swings.
NAR began tracking of metropolitan area median single-family home prices in 1979; the metro area condo price series dates back to 1989.
The seasonally adjusted annual rate for a particular quarter represents what the total number of actual sales for a year would be if the relative sales pace for that quarter was maintained for four consecutive quarters. Total home sales include single-family, townhomes, condominiums and co-operative housing.