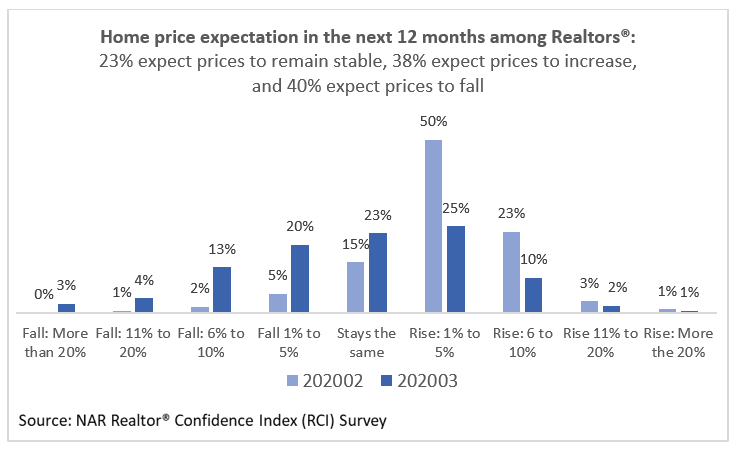
Realtors® have mixed expectations about the direction of home prices in their markets in the next 12 months, according to NAR’s March 2020 Realtors® Confidence Index (RCI) Survey, a monthly survey of Realtors® about the characteristics of their transactions in the reference period (March 2020) and their outlook in the next 12 months.
The survey asks respondents “In the neighborhood(s) or area(s) where you make the most sales, what are your expectations for residential property prices over the next year?” Among the 4,063 respondents, 23% expect prices to remain stable, 38% expect prices to increase, and 40% expect prices to fall. The median expected price change is -0.5%.
Only 3% expect prices to fall more than 20%, so Realtors® are not expecting prices to collapse as they did during the Great Recession when prices fell by 25% during 2006 to 20111.

Indeed, home prices are still rising nationally: as of March 2020, the median home sales price rose 8% on a year-over-year basis to $282,500, the 97th straight month of consecutive price gain since 2012. Prices have held up due to a combination of measures under the $2.2 trillion Coronavirus Aid, Relief, and Economic Security (CARES) Act passed plus the additional $484 billion funding passed April 23 to pay for unemployment insurance benefit claims and payroll assistance for small businesses. The CARES Act also requires mortgage forbearance for up to one year for federally-backed mortgages, which account for 64% of residential mortgages.2 Private lenders are also providing mortgage forbearance. Mortgage Bankers Association reported that total loans rose to 5.95% during the week of April 6-12 compared to only 0.25% of all loans in forbearance for the week of March 2.3
States likely to see lower demand for vacation and rental homes and weak home prices
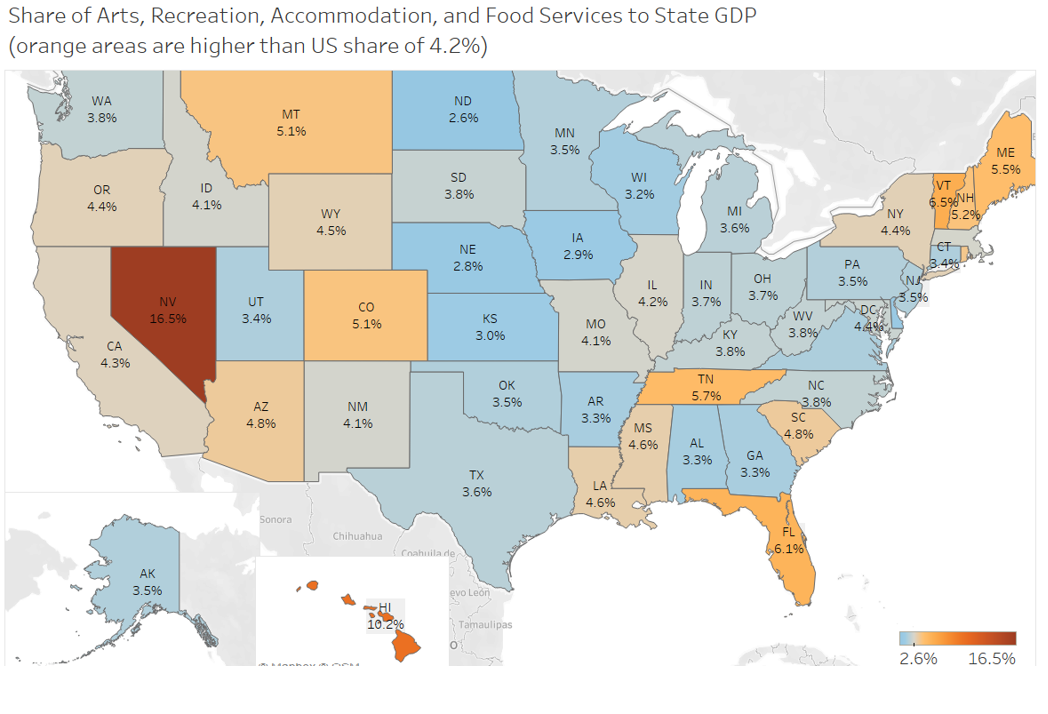
The survey does not have enough responses to enable a tabulation of price expectations by state. However, one can expect that home prices are more likely to be negatively impacted by the social distancing measures and the concomitant rise in unemployment in states where the arts, recreation, accommodation, and food services industry make up a larger proportion of GDP. These are: Nevada (16.5%), Hawaii (10.2%), Vermont (6.5%), Florida (6.1%), Maine (5.5%), New Hampshire (5.2%), Colorado (5.1%), and Montana (5.1%), Rhode Island (4.9%), and Arizona (4.8%). Although social distancing measures are relaxed, social distancing guidelines are still likely to be observed, reducing tourist foot travel in these areas.
Median Listing Prices in top 100 metro areas as of April 18, 2020
As of April 18, 58 out of 100 largest metro areas still had higher median listing prices on Realtor.com compared to one year ago. However, this is a decline from the 65 metro areas that had y/y price gains in the prior week ended April 11. Except for Urban Honolulu, the drop in median listing price on a year-over-year basis has not been at double-digit rates. However, properties are staying longer on the market for six more days during the week of April 18 compared to one year ago, up from an additional one day on the market during the week of April 11 compared to one year ago.
In Urban Honolulu, the median listing price is down by 14% from one year ago. The median listing prices are also lower compared to one year ago in several Florida metro areas: Jacksonville, Deltona-Daytona, Orlando-Kissimmee-Sanford, Tampa-St. Petersburg-Clearwater, and Miami-Fort Lauderdale.
However, in Las Vegas, the median listing prices are still up from one year ago (3.6%) and are holding from one week ago (0.3%).
In Denver, Colorado, the median listing prices are still also up from one year ago (3.5%), but slightly down during the week of April 18 from the prior week (-0.7%)
In San Francisco, the median list price is just slightly last year’s (-0.1%), and prices were up during the week of April 18 compared to the prior week (0.1%). In Los Angeles, the median list prices are significantly up from one year ago (16%), though prices are also just slightly down from a week ago (-0.6%).
In Seattle, the median listing prices are lower as of April 18 compared to one year ago (-4.6%) as well as the prior week (-1.6%), though modestly.
In New York-New Jersey, which accounts for the largest share of coronavirus cases in the US, the median listing prices are still up from one year ago (2.9%) as of April 18 and from one week ago (0.6%).
In Washington, DC, median listing prices are still up from one year ago as of April 18 (4.4%) and unchanged from the prior week.
Use the data visualization below to view the median list prices in 100 metro areas as of April 18:

1 The median existing-home sales price rose to an average of $221,900 in 2006 (peak year average) and fell to an average of $166,200 in 2011.
2 Table L.218, Z.1 Financial Accounts of the United States, Federal Reserve Board, March 2020.
3 MBA's Forbearance and Call Volume Survey. https://www.mba.org/2020-press-releases/april/share-of-mortgage-loans-in-forbearance-rises-to-595


