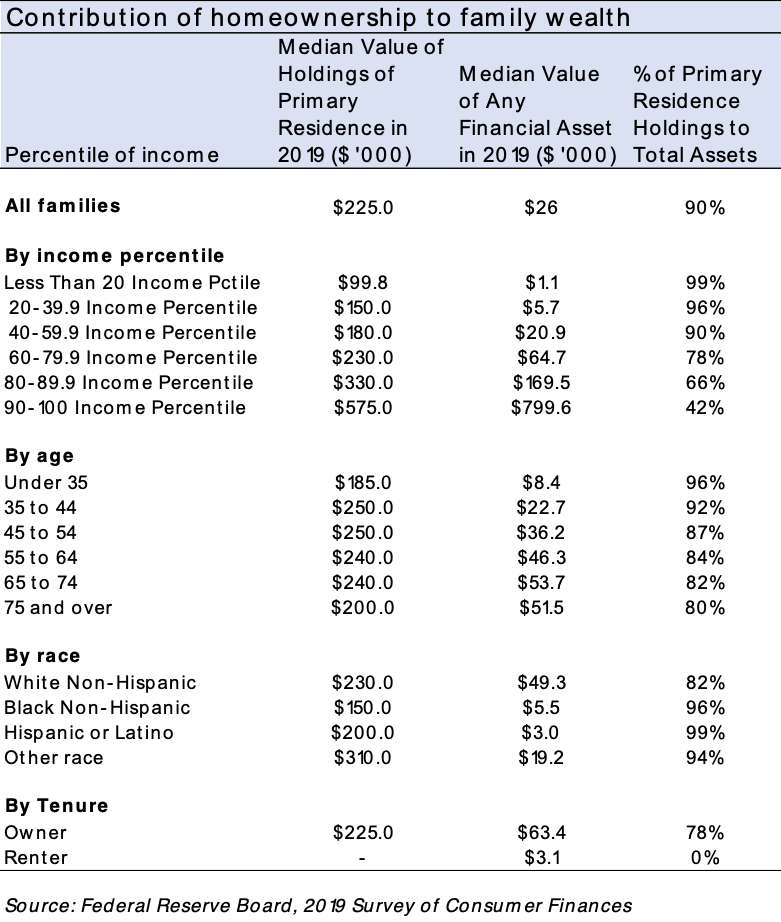
Homeownership is the key pathway to build wealth and narrow the racial income and wealth inequality gap. Among all families, the ownership of primary residence typically accounts for 90% of total wealth and 78% among homeowners.1 Among those in the bottom 20% of the income percentile, the median value of holdings for a primary residence accounts for 99% of total family assets, but only 42% for families in the top 10% of the income bracket. By race, it accounts for at least 94% of the wealth of Hispanic (99%), Black (96%), or families of other races (94%). Among families headed by a person 44 years old or younger, it accounts for over 90% of wealth.
Housing wealth accumulation takes time and is built up by paying off the mortgage debt and by price appreciation. And while home prices can fall, home prices tend to recover and go up over the longer term. As of September 2020, the median existing-home sales price was $313,000, a 36% gain since July 2006 when prices peaked to $230,400.

Wealth Gains by Metro Areas as of 2020 Q3
Nationally, a person who purchased a typical home 30 years ago would have typically gained about $305,480 as of the third quarter of 2020. Of the total wealth gain, 70% or $215,333 is from the price appreciation of 3.9% annually. Over a 10-year period, the wealth accumulation is $167,977, of which $135,667 is from the price appreciation, with prices rising by 5.8% annually.
Use this data tool to view the wealth accumulation data by metro area:
Nine of the top 10 metro areas with the largest housing wealth gains over a 10-year period were in the West: San Jose-Sunnyvale-Sta. Clara; San Francisco-Oakland-Hayward; Anaheim-Sta. Ana-Irvine; Los-Angeles-Long Beach-Glendale; San Diego-Carlsbad; Boulder, Colorado; Seattle-Tacoma-Bellevue; Urban Honolulu, Hawaii; Naples-Immokalee-Marco Island; and Denver-Aurora Lakewood, Colorado.
However, in terms of the home price appreciation, the top metro areas with the highest price appreciation are Cape Coral Fort-Myers, Florida; Boise-City-Nampa; Idaho; Grand Rapids, Michigan; Punta Gorda, Florida; Sherman-Denison, Texas; Palm-Bay-Melbourne-Titusville, Florida; Reno, Nevada; Port St. Lucie, Florida; Phoenix-Mesa-Scottsdale, Arizona; and Las Vegas, Nevada.
Most Affordable Metros as of 2020 Q3
Rising prices benefit home sellers, but rising home prices are also hurting the ability of potential homebuyers to purchase a home. Eight of the top 10 expensive metros are on the West Coast. So the potential to purchase a property and to build wealth will be happening in the affordable areas in the Midwest and South in Texas, Kansas, Ohio, South Carolina, and North Carolina. Metro areas remain relatively affordable in Phoenix, Idaho, Washington, Vegas, compared to the expensive metro areas in California.
1 Federal Reserve Board, Survey of Consumer Finances


