Homeownership is a key pathway to building wealth and narrowing the racial income and wealth inequality gap. Housing wealth (equity) accumulation takes time, and is built up by price appreciation and paying off the mortgage. Homeowners who purchased a typical single-family existing-home 30 years ago at the median sales price of $103,333 with a 10% down payment loan and who sold the property at the median sales price of $357,700 in 2021 Q2 accumulated housing wealth of $349,258, of which 73% is due to price appreciation.
Out of 182 metro areas, there were 21 metro areas with a typical housing wealth gain over a 30-year period of at least $500,000. Eleven of these metro areas are in the West region states of California (San Jose, San Francisco, Anaheim, San Diego), Hawaii (Honolulu), Colorado (Boulder, Denver), Washington and Oregon (Seattle, Portland), and Nevada (Reno). In the three metro areas ― San Francisco, San Jose, and Anaheim ― the typical housing wealth gain was over $1 million, which was primarily from the price appreciation. Seven metro areas are in the Northeast region states of New York and New Jersey (Nassau County, New York-Newark-Jersey City, Newark, New York-Jersey City-White Plains), Connecticut (Bridgeport), and Massachusetts (Boston, Barnstable), and three in the South region states of Florida (Naples), Texas (Austin) and the Washington DC-Arlington-Alexandria metro area.
Rising home values benefit existing homeowners, but home prices need to rise in line with income growth so homes remain affordable and more households are able to reap the benefits of homeownership. As seen in the table above, over the past five years, the median single-family existing-home sales price increased by 8.2% compared to the annual growth of 3.5% in average weekly wages. It is therefore critical to improve the supply of housing to enable more families to participate in the benefits of homeownership.
Homeownership: Less Risky Investment than a Stock Market Investment
While home prices can fall, they tend to recover and rise over a long-term period. Over a 30-year period through the second quarter of 2021, the median single-family existing home prices have increased at an annual pace of 4.6%. Most homebuyers purchase a home as a primary residence, but some buyers purchase properties as an investment. Over a 30-year period, an investment in a stock market yielded a higher return of 8.9% based on the S&P 500 index, but the returns are also more volatile, with a risk-to-return ratio of nearly 1.8 compared to 1.3 on an investment in a single-family existing home.

Homeownership: Major Source of Wealth Among Families
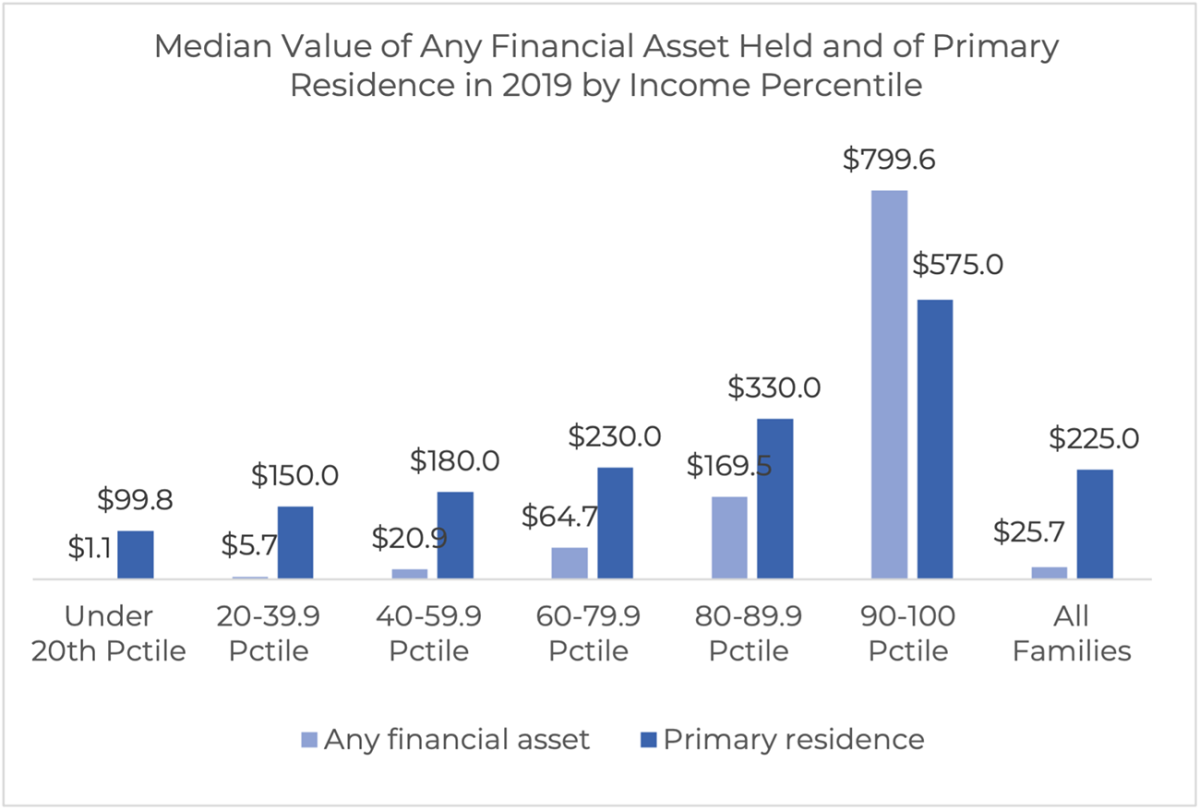
Among all families, the value of the primary residence typically accounts for about ten times the median value of any financial asset, according to the 2019 Survey of Consumer Finances of the Federal Reserve Board.

Uses of Home Equity
Housing wealth benefits homeowners because homeowners are able to tap into their home equity to preserve the value of the home and to improve their level of income and their children's, through uses of the home equity to invest in a business, for education, to pay off debt, and for unexpected needs such as medical expenses.
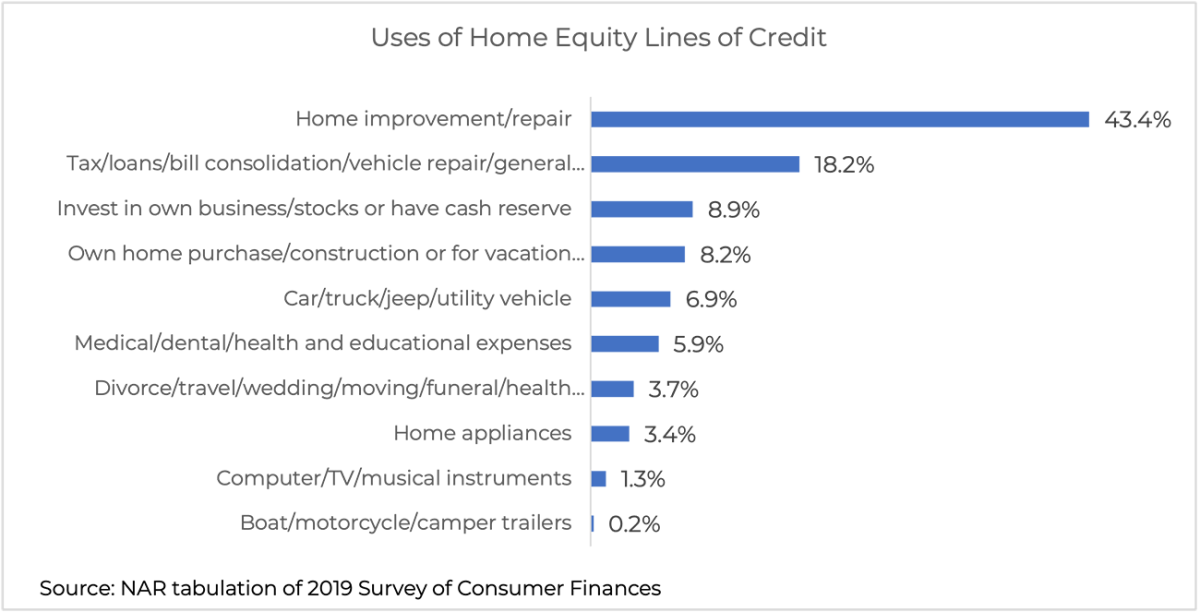
According to NAR’s tabulation of the 2019 Survey of Consumer Finances, 43% of homeowners who had a home equity line of credit used the home equity for home improvement and repair. This is important because home improvement and repair helps maintain the value of the home arising from depreciation and aging. Paying off taxes and loans and general expenses accounted for 18% of the uses of a home equity line of credit. About 9% of homeowners who obtained a home equity line of credit used the equity to invest in a business, stock, or build up a cash reserve. Homeowners also used the home equity line of credit to buy a second home. Paying for major expenses like health, medical, or educational expenses were other uses of the home equity line of credit.

For more, read the full report.


