As of 2018, the median duration of homeownership in the U.S. is 13 years1. Compared to previous years, homeowners opt to spend more time holding onto their residences. Median tenure has increased by 3 years since 2008.
Nevertheless, homeownership duration varies from area to area. Homeowners in some metro areas move more frequently than homeowners in the rest of the country. To begin our analysis, we looked at the median years of residence for owner-occupied homes located in the 100 largest U.S. metro areas. The American Community Survey provides estimates about the median year that owners moved into their homes. As data shows, homeownership duration varies from 6 to 18 years in the 100 largest metro areas. In more than half of these metro areas, homeowners spend less time holding onto their primary residences than the typical homeowner across the country.
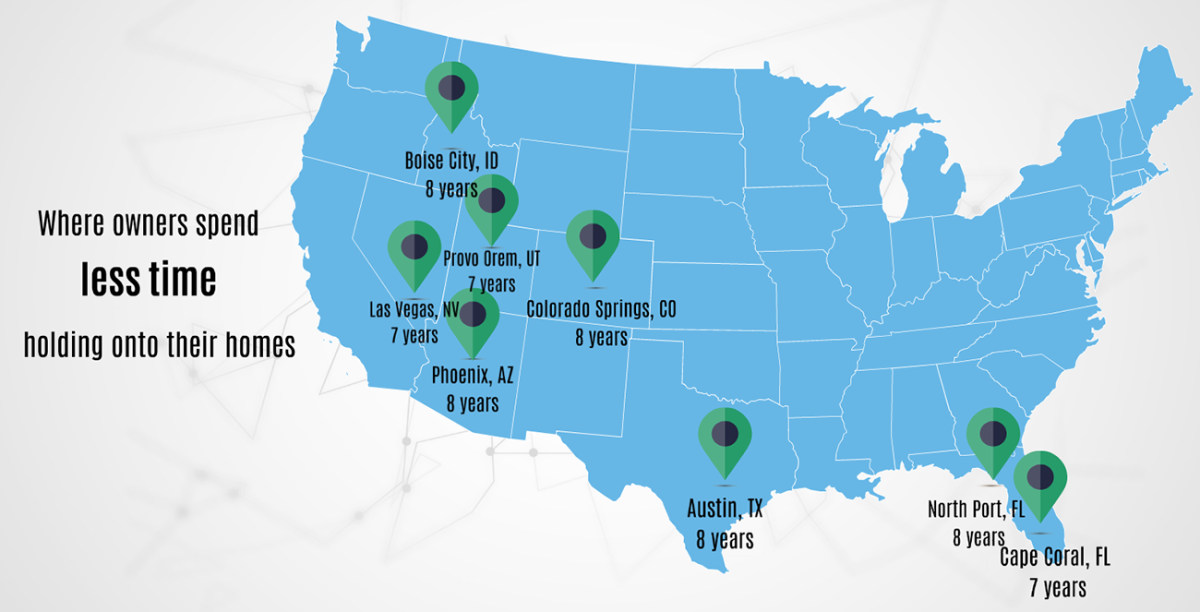
Specifically, homeowners in the following areas typically stay up to 8 years in their homes:

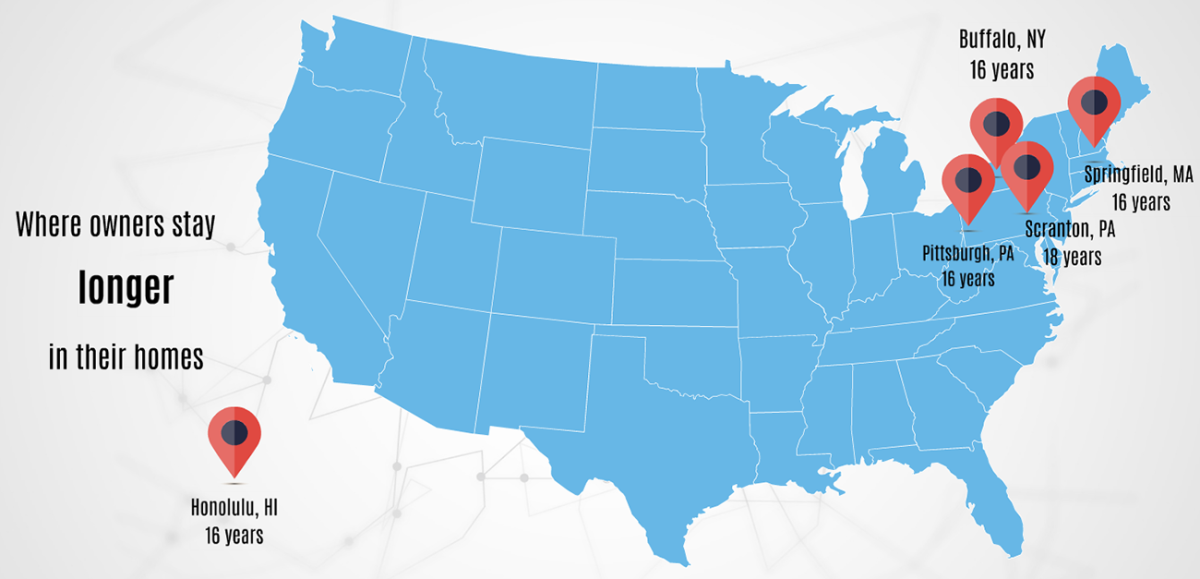
In contrast, the following metro areas had a median homeownership duration of 16 years and higher:

As the data shows, many of the fastest-growing metro areas had the lowest median tenures. For instance, in Austin-Round Rock, TX, owners typically stay for 8 years in their homes while 18 percent of the total population moved within the last 12 months in 2018. Respectively, in Colorado Springs, CO the median homeownership duration was 8 years while the share of recent movers was 21 percent.
In contrast, in New York-Newark-Jersey City, NY-NJ-PA where fewer people moved recently (9%), the typical homeowner stayed for 15 years. Similarly, the median homeownership duration was 15 years in Los Angeles-Long Beach-Anaheim, CA while 9 percent of the total population moved within the last 12 months.
Housing supply shortage and low affordability are two of the main reasons that people stay longer in their homes. Firstly, the number of building permits for single-family homes issued in 2018 compared to a year earlier was lower in the metro areas with median homeownership duration above 13 years. While there are fewer inventory options, sellers in these areas may find it harder to find and purchase their next homes. Thus, they stay longer in their homes and fewer homes are available for first-time homebuyers. On the contrary, permits increased by 4% in the metro areas where homeowners stay less than 13 years in their homes.
Moreover, housing is more expensive in the areas with the highest median tenures. Although short supply increases the seller’s profit, it also difficult for these sellers to afford to purchase their next homes. As data reveals, the median home price of recently purchased homes was 10 percent higher in the areas with a median homeownership duration above 13 years compared to other metro areas.
Homeowners staying longer in their homes can further reduce the number of homes for sale. Homeowners will likely be further locked in place because it is difficult to sell and buy a home at the same time. That being said, finding ways to build more housing will help, but the ultimate goal is to increase the number of existing homes available on the market. This can only happen if these existing owners’ homes go on the market.
However, metro areas with smaller homeownership duration are expected to have a boost of housing activity in the upcoming years. Since these areas have more homes available for first-time homebuyers than other metro areas, more newcomers will likely arrive. As first-time homebuyers become a greater proportion of all homeowners, the median homeownership duration will fall further in these areas.
Hover over the map to see how long owners of different metro areas opt to stay in their homes.
- In green metro areas, homeowners spend less time holding onto their residences compared to nationwide
- In grey metro areas, homeowners spend 13 years
- In orange metro areas, homeowners spend more time holding onto their residences compared to nationwide
1According to the 2018 1-year American Community Survey.


