With most states lifting the restrictions of business and public spaces, hundreds of millions of people started moving around again. However, as cases are rising, some of these states have ordered new restrictions. The National Association of REALTORS® is monitoring the mobility of people during the pandemic to gain some insights about the impact of the COVID-19 on the local economy. Mobility typically brings economic development and, subsequently, a faster recovery in the local economy from the recent shutdown orders.
Google produces daily COVID-19 Community Mobility Reports. These reports show movement trends by area, across different categories of places. Specifically, this new dataset measures visitor numbers to specific categories of location (e.g. grocery stores; parks; train stations) every day and compares this change relative to a baseline day before the pandemic outbreak. Baseline days represent a normal value for that day of the week, given as median value over the five‑week period from January 3rd to February 6th, 2020. Measuring it relative to a normal value for that day of the week is helpful because people obviously often have different routines on weekends versus weekdays.
Here are the high-level categories of places for which we are able to get data:

Before analyzing the data, here are a few tips that could help us understand the trends:
- The Residential category is measured in different units (duration rather than visitors) so we shouldn’t compare this change with other categories. People already spend a lot of time at home, so changes in Residential are likely to be smaller.
- Visits to Parks and outdoor spaces are highly influenced by weather and holidays – we would expect larger spikes in this category. In contrast, visits to workplaces drop dramatically, especially during holidays.
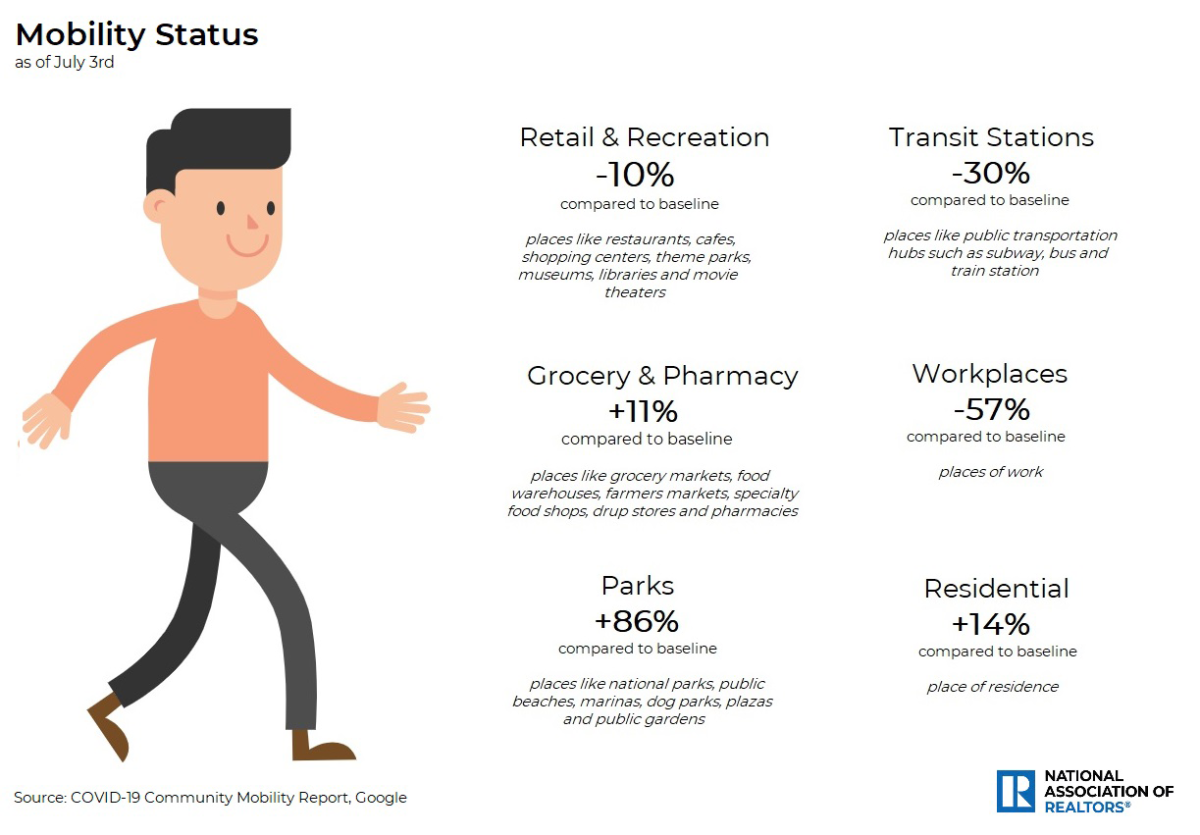
Here is the mobility status for the typical American, according to the report on July 3rd:

See also here how visits to these specific places change since the beginning of the pandemic:
As the data shows, people are currently going to parks, groceries, and pharmacies more than they used to do in the baseline period. Specifically, visits to parks increased 86% while visits to groceries and pharmacies rose 11% compared to normal, according to the report on July 3rd. In contrast, people aren’t visiting retail and recreation stores, transit stations, and workplaces as frequently. Mobility in these places is still below the pre-pandemic levels. For instance, visits to transit stations are currently -30 percent on average compared to -52 percent in the week ending April 12. Actually, based on the chart, most of these categories reached their lowest level on April 12th with most of the states under stay-at-home orders at that time. As for the time spent in home, people tend to spend less time in their residences but still stay home more compared to pre-pandemic days.
This dataset also provides information for each state. The visualization below shows you how mobility has been trending in each state across the country:
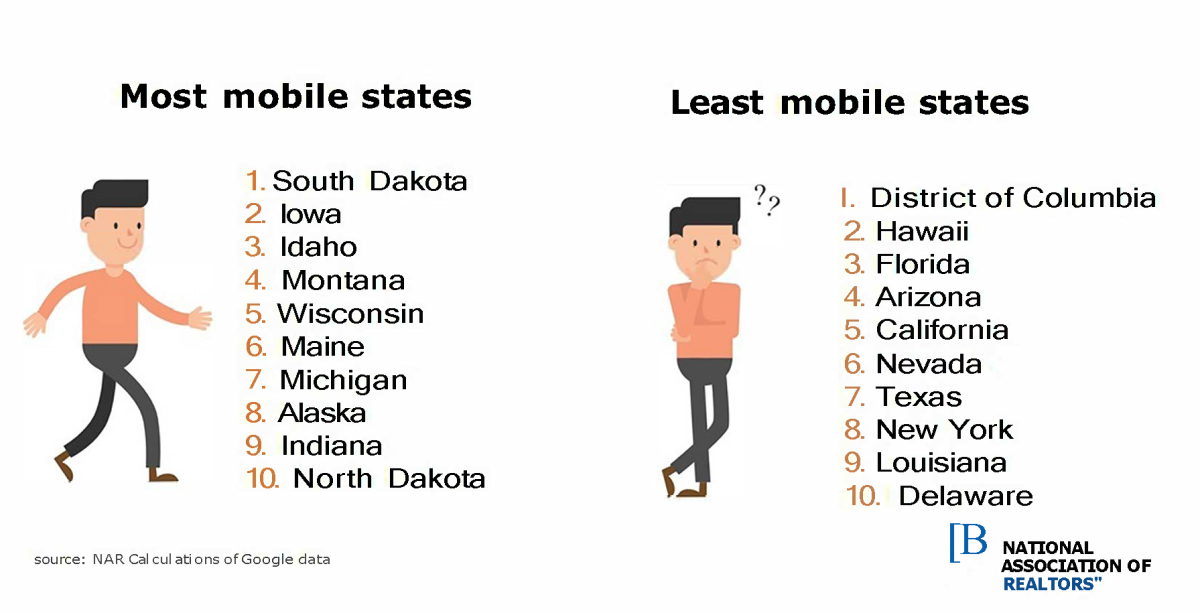
After comparing mobility trends for each state, the National Association of REALTORS® was able to identify the most and least mobile states during the pandemic. Thus, as of July 3, the top 10 states for each category are:

In the meantime, after comparing employment conditions for each state, these 10 most mobile states experienced fewer job losses than most of the other areas across the country. Specifically, employment dropped by 11% on average in the most mobile states compared to 13% in the least mobile states. For instance, in May, employment declined 6% in Idaho; 8% in South Dakota; and 9% in Montana. However, employment dropped by 20% in Hawaii; 18% in Nevada; 18% in New York; and 16% in Delaware. Thus, these markets are expected to outperform compared to the other areas and recover faster from the COVID-19 effects on their local economy.


