by NAR Research staff
Understanding Trends in Single-Family Building Permits Across Metro Areas
The housing market has always been one of the main drivers of our country's economic activity. Limited housing supply is one of the main reasons behind rising home prices, declining affordability, and constrained housing activity. Therefore, understanding its dynamics can provide valuable insights for policymakers, developers, and investors.
The National Association of REALTORS® closely monitors housing production at the local level using various metrics. At the same time, there are multiple ways to estimate the necessary number of homes that our country needs. NAR compares these in the quarterly Local Market Reports, which show the current levels with the historical average to identify where housing is increasing faster, or housing construction is lagging. This analysis of single-family permits across various metro areas reveals significant trends and variations, shedding light on the current state and historical context of housing construction in the United States.
Housing Construction at the National Level
Before delving into each local market, at the national level, housing construction peaked in 2005 with over 2 million housing starts. Then construction bottomed out in 2009 with about 550,000 housing starts, while the historical average is about 1.5 million starts. Since its peak in 2005, the country returned to the historical average level in 2021 and 2022. While construction fell again below the average level in 2023, the country is currently building about 900,000 more homes than its lowest level. Considering the historical average level of housing construction and 14 years of underproduction, it's estimated that our country still lacks 4.7 million homes.
Production of Housing at the Metro Area Level
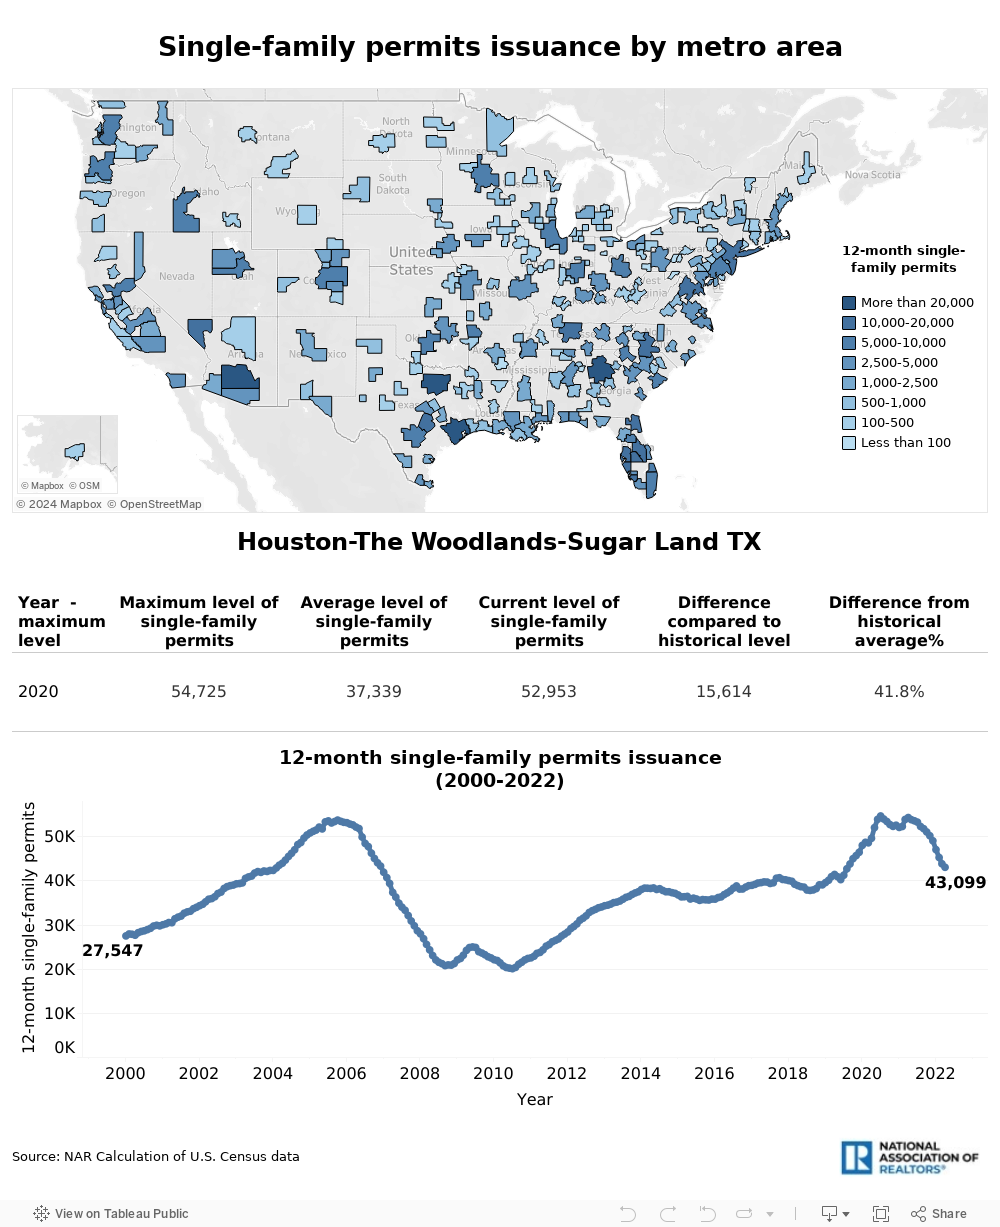
At the local level, certain areas stand out for their increased construction activity, producing more housing than their historical averages. This trend can be attributed to various factors such as economic growth, population influx, and urban development initiatives. In this analysis, we explore metro areas that are currently producing more single-family housing than their historical norms based on recent permit data. To do that, we computed the number of single-family building permits issued over a 12-month period across 261 metro areas. Key metrics include the maximum number of permits issued within a year, the date and year when this peak occurred, the current number of single-family permits, and the historical average levels of single-family permits. By examining these metrics, we can discern patterns and shifts in the local housing market.
Key Findings
Maximum Single-Family Building Permit Levels and Peaks
Since metro areas of different sizes are included in this analysis, the data shows substantial variability in the maximum number of single-family permits issued within a 12-month period, ranging from as few as 54 permits (Wheeling, WV-OH) to an astonishing 60,912 single-family permits (Atlanta-Sandy Springs-Alpharetta, GA). On average, most metro areas reached their peak permit levels around 2006, a period marked by significant construction activity before the 2008 financial crisis.
Current Level of Housing Construction Activity
Among the 261 studied metro areas, housing construction currently varies from only 13 single-family permits - Wheeling, WV-OH – to 52,953 in Houston-The Woodlands-Sugar Land, TX, issued within a year.
Comparative Analysis: Current vs. Historical Level of Housing Construction
On average, metro areas are seeing an 18% increase in current single-family permits compared to historical averages, indicating a slight uptick in housing construction. This increase is crucial for addressing housing shortages in many metro areas.
Top-Performing Metro Areas
Several metro areas exhibit significant increases in housing production. Here are a few notable examples:
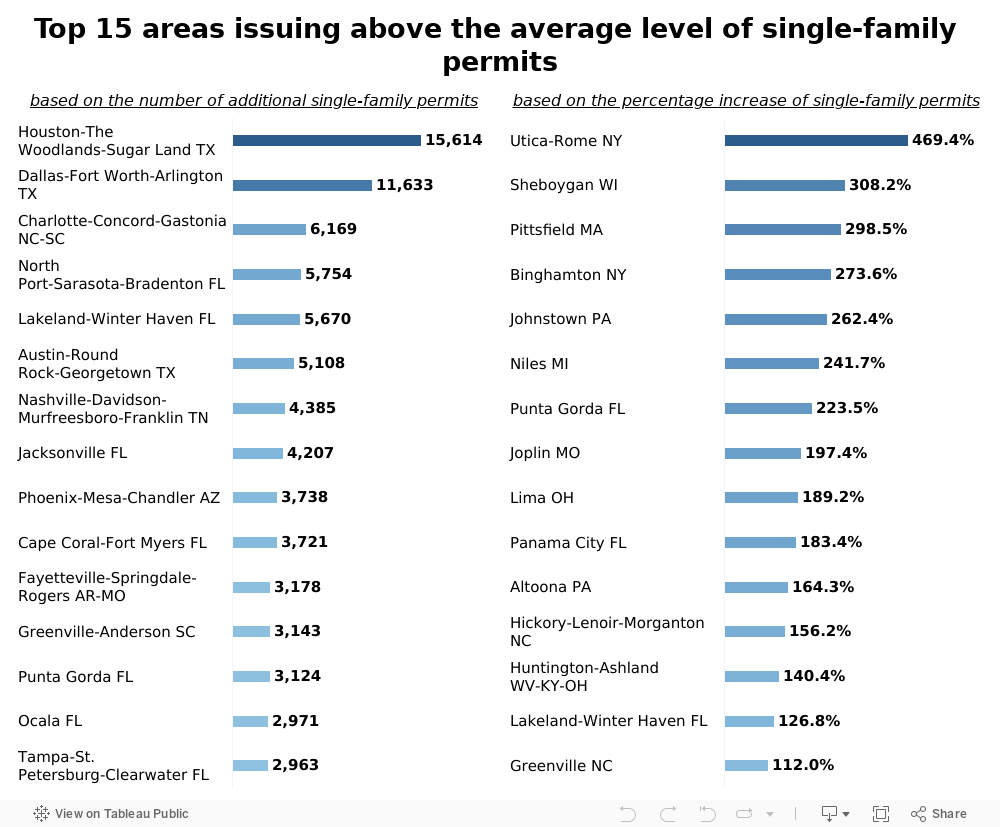
Based on the Number of Additional Single-Family Permits
Houston and Dallas metro areas in Texas are the top two areas with the most additional single-family permits compared to their historical averages. These two metro areas currently issue more than 11,000 single-family permits within a year above the historical average. Charlotte, North Carolina, follows with about 6,200 additional single-family permits.
An unexpectedly good finding was that a few metro areas are producing more single-family housing than ever before. Punta Gorda, FL, Panama City, FL, and Fayetteville, AR-MO are the top three metro areas issuing more single-family permits than ever before. For example, the Punta Gorda, FL market currently issues about 356 more single-family permits. In addition, nearly 190 more single-family permits have been issued in the Fayetteville, AR-MO metro area within the last 12 months ending in April.
Based on the Percentage Increase
Another way to identify the areas with the most gains in single-family construction is to compare the percentage increase from their historical averages. This method can be used to capture smaller metro areas, while the previous method showed the areas with the largest number of additional single-family permits. Indeed, data shows that smaller areas – such as Lakeland and Ocala metro areas in Florida and Fayetteville, AR-MO – issue more than twice the number of single-family permits yearly compared to their historical averages.
Areas Where Housing Construction is Most Delayed
In contrast, many other metro areas are also struggling to wrap up housing production. Chicago, IL-IN-WI, Washington, D.C.-VA-MD-WV, and Seattle, WA, are the three metro areas with the largest number of single-family permits below the historical average level. For example, the historical level of single-family permit issuance in the Chicago metro area is about 14,690 permits per year, but this area is currently issuing only 8,660 single-family permits within the last 12-month period.
Using the percentage difference between the current and historical levels, smaller metro areas also underproduce. Specifically, Anchorage, AK, Rockford, IL, and Bismarck, ND, issue 60%+ below the historical average level. For instance, Anchorage, AK, issued fewer than 200 single-family permits in the last 12 months, while the historical average is about 700 permits per year.
Do Larger or Smaller Metro Areas Lag Behind Historical Levels of Single-Family Permits?
Understanding whether larger or smaller metro areas are lagging behind their historical levels of single-family permits can offer valuable insights into regional housing market dynamics. In this analysis, we also explore the trends in building permits across different metro areas, examining whether size plays a role in meeting or exceeding historical averages.
For this analysis, the metro areas were categorized into "larger" and "smaller" based on their historical average permit levels, providing a clear comparison. Thus:
- Larger Metro Areas: These areas have historically high levels of single-family building permits (at least 830 single-family permits within a year).
- Smaller Metro Areas: These areas have historically lower levels of single-family building permits (less than 830 single-family permits within a year).
The analysis reveals that larger metro areas, despite their historical dominance in housing production, are currently lagging behind their historical averages. With only a 9.3% increase in permits, these areas seem to face several challenges to wrap up housing production. Stricter zoning laws and building regulations can slow down new housing developments. At the same time, the cost of land and construction in larger metro areas tends to be higher, potentially deterring new projects. Consider a metro area like Oklahoma City, OK, with a historical average of around 5,490 permits within 12 months. Despite its size, the current trend shows a modest increase of 3% above the historical average. Another example with an even larger metro area is the Atlanta-Sandy Springs-Alpharetta, GA metro area, which currently issues 9% – 2,612 single-family permits – below its historical average level.
In contrast, smaller metro areas are significantly outperforming their historical averages, with a 26.1% (on average) increase in single-family building permits. This robust growth can be attributed to several factors, such as more available land and less competition, making these areas attractive for new developments. In addition, many smaller metro areas have implemented policies to encourage growth, such as tax incentives for builders and streamlined permitting processes. Take Abilene, TX, with a historical average of approximately 272 permits: It has recently seen a significant increase to 338 permits (up 24% from the historical average), demonstrating how smaller metro areas leverage growth opportunities.
The data reveals a clear trend: Smaller metro areas lead in single-family home construction, significantly outpacing their historical averages. In contrast, larger metro areas, while still growing to meet demand, are lagging behind their historical performance.
By continuing to monitor these trends, policymakers can better anticipate changes in the housing market, address potential shortages, and support sustainable growth. Please visit NAR's Local Market Reports for a more detailed breakdown of specific metro areas or further analysis.